Sections / Articles
Raising the Bar: What Data-Driven Improvement Really Looks Like
By Mary LeDoux
Principal, September/October 2016
I’m a data-driven individual. Data plays an integral role at my school, Eastside Elementary, where my team and I are working to improve teaching and learning in every classroom and for every student. In fact, there’s not a day that goes by that we’re not using data. There’s not a decision made here that’s not data-driven. But this wasn’t always the case.
Two weeks before I took the helm as principal in the summer of 2013, Eastside Elementary received an “F” school performance grade from the Florida Department of Education. My new assistant principal and I had only five days to prepare before teachers returned to work. When we arrived, we learned that many teachers had been shuffled to different grade levels and subject areas. So one of the first things we did was review each teacher’s data. Specifically, we looked at a variety of data points for their students, including the Florida Assessments for Instruction in Reading, Florida Comprehensive Assessment Test, and our district’s science and math benchmark assessments. If a teacher’s track record was good, we moved the teacher back to the grade level and subject he or she had taught before, which was a huge relief for the teacher.
Step 1: Deep Data Dive
I knew that schools could, of course, be labeled failing for many reasons. So I continued digging into the data to determine why students weren’t excelling and what could be done to turn things around.
 At Eastside Elementary, 83 percent of students are economically disadvantaged. In fall 2013, 100 percent of our students were at least two years below grade level in reading and math. When we looked deeper, we quickly discovered that students had not been receiving interventions at the correct levels, and there were no Tier III interventions. If your lower-quartile students are struggling year after year and they’re not getting the specialized services they need, that’s definitely going to impact your school grade.
To determine which students needed intensive intervention to get back on track, we dove into each student’s data to see how each individual had been progressing over time. In that first year, we signed off on 56 new referrals for special education. We knew that was a lot of referrals for one year, but we had years of data showing us that these children needed more support than the school had provided.
Next Steps: Interventions and Problem-Solving
We began using an online assessment platform, which also includes comprehensive reporting and analytics, called Unify from Performance Matters. It not only allows us to see how our students are progressing, but it also gives us the data we need to provide targeted interventions.
The members of our school leadership team — the assistant principal, assessment teacher, instructional practice coaches, guidance counselors, and I — log in to the system daily to review, analyze, and act on student performance data. The team also provides reports to teachers, who use the data to guide their instructional decisions in the classroom and when they meet in professional learning communities.
In addition, every Tuesday, I participate in problem-solving meetings as part of our Multi-Tiered System of Supports/Response to Intervention process. The data shared in these meetings help me decide where we need to provide coaching, professional development, or additional resources.
At the end of the school year, I provide teachers with historical performance data for each of their incoming students. This allows them to determine how they’re going to work with their students so they can hit the ground running on day one of the new school year.
I’m passionate about providing targeted assistance to our students and getting students the resources they need to be successful. To do that, easy access to data is essential. For example, a fifth-grade teacher and I examined performance data for her students and saw that one student was really struggling in math. When we looked at the student’s history, we noticed that the student had been to several schools in the county since kindergarten. When we looked deeper, we saw that the student’s performance noticeably changed between kindergarten and first grade. We had a conversation with the parent about what happened that year. We realized that, in addition to providing academic interventions, we needed to also offer social-emotional interventions as well.
Results
From 2013 to 2014, the percentage of students achieving proficiency on our state tests increased in both reading and math. These are results from our Florida Comprehensive Assessment Test showing the percentage of students scoring “Satisfactory” or above:
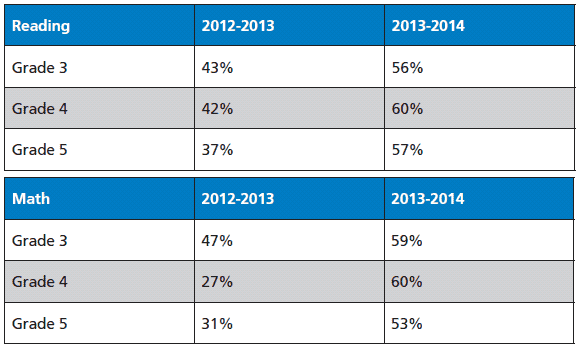
We also raised our school grade from an “F” in 2013 to a “C” in 2014. Needless to say, we were thrilled. We earned a “B” in 2015, and we’re still chasing that “A.” We are excited about the success we’ve achieved — and data- driven decision-making has been an important part of our efforts, right from the start.
Mary LeDoux is principal of Eastside Elementary School, a Title I school in Brooksville, Florida.
Copyright © National Association of Elementary School Principals. No part of the articles in NAESP magazines, newsletters, or website may be reproduced in any medium without the permission of the National Association of Elementary School Principals. For more information, view NAESP's reprint policy.
| Attachment | Size |
|---|---|
| LeDoux_SO16.pdf | 172.85 KB |